3.6x ROAS and CAD $325k Monthly Revenue for Havenwood Home
- Blended ROAS
- 3.6x
- from 1.9x
- Monthly Revenue
- CAD $325k
- from CAD $135k
- Repeat Purchase Rate
- 24%
- from 11%
- Cost Per Acquisition
- CAD $202
- from CAD $285
Overview
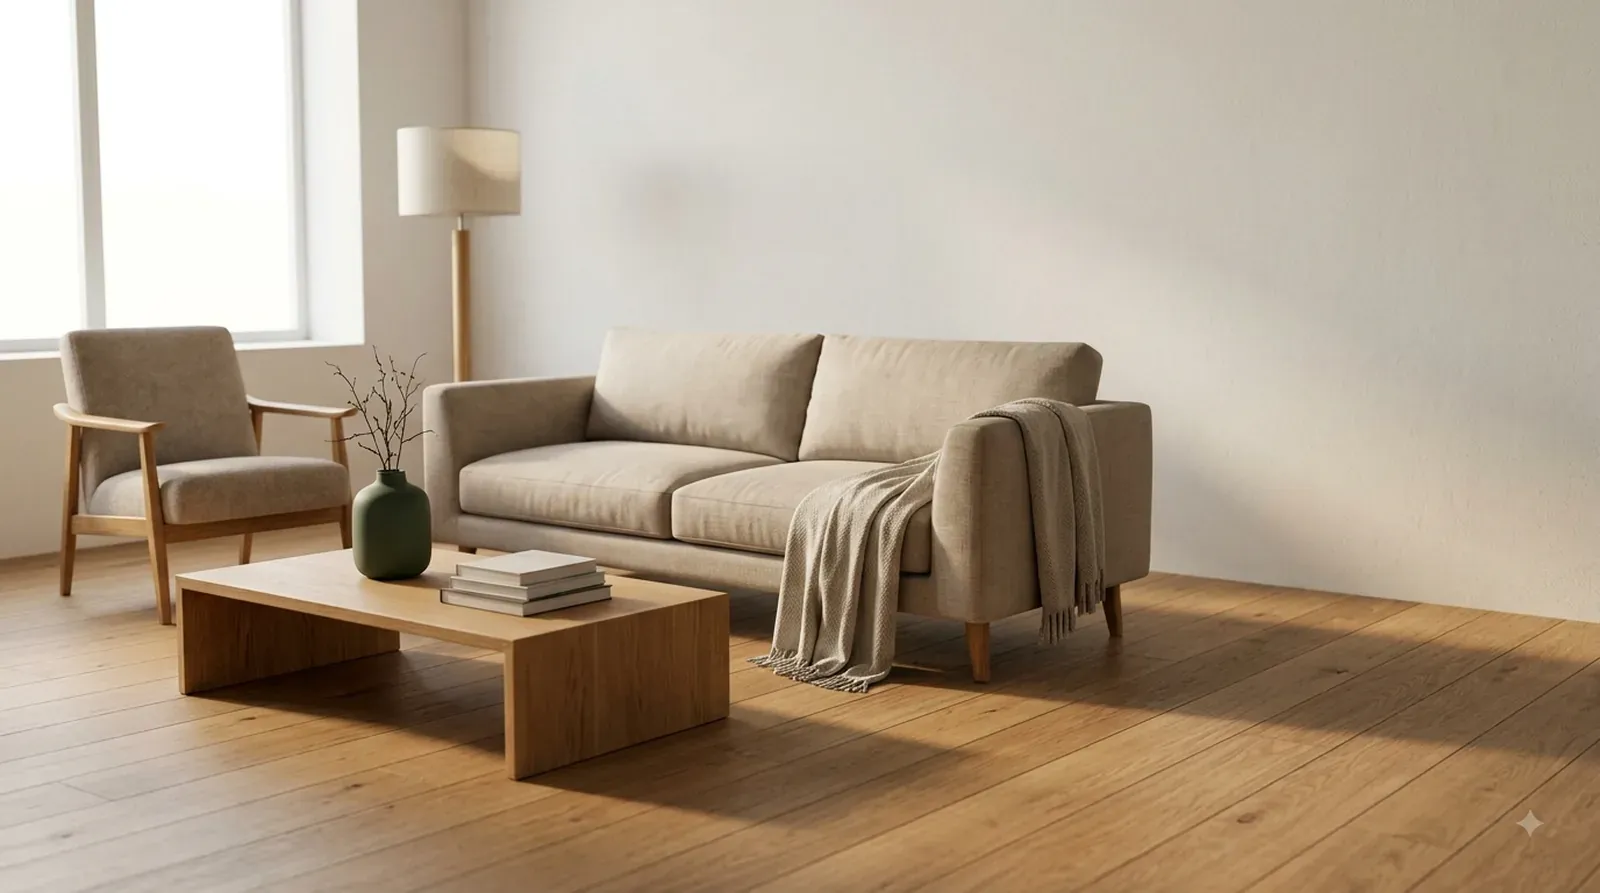
Havenwood Home is a direct-to-consumer home goods and furniture brand based in Toronto, selling modern solid-wood furniture and décor exclusively through Shopify at a CAD $460 average order value. We started working with Havenwood in September 2024, when monthly revenue sat around CAD $135,000 on roughly CAD $95,000 of average monthly ad spend, blended ROAS at 1.9x, and CPA at CAD $285. Today, monthly revenue has grown to CAD $325,000 and blended ROAS sits at 3.6x.
A storytelling problem, not a traffic problem
A solid-wood furniture purchase isn’t decided from a white-background product photo. Going into September 2024, Havenwood’s product pages failed to communicate scale, materials, or how a piece would actually sit in a room — exactly the questions a CAD $460-plus considered purchase raises before someone commits. Creative fatigue and broad targeting compounded the problem, spreading spend across audiences that diluted efficiency rather than reaching people already weighing a purchase like this.
We treated this as a storytelling and consideration-cycle problem, not a pure traffic problem, and built the account around answering the questions a buyer actually has before she’s ready to buy solid wood furniture sight unseen.
Four workstreams, from feed to inbox
1. Google Shopping — product-level bidding and richer data
We rebuilt Google Shopping around product-level bidding and rewrote titles and attributes — wood species, exact dimensions, finish — because generic listings were giving the algorithm too little to work with. This is the cleanest before/after evidence in the account: Google Shopping’s own share of total revenue rose from 31% to 47% over the engagement, as richer product data let the algorithm match specific pieces to specific searches instead of competing on generic furniture terms.
2. Meta — room-setting video and carousel
We moved Meta to room-setting video and carousel formats, shot in real Canadian home interiors, so a buyer could see scale and material in context rather than against a white background. These campaigns reached 4.1x to 4.8x ROAS in their mature periods — well above the account’s blended average — as the creative and audience systems compounded over time rather than in any single jump.
3. Product pages rebuilt for scale and material
We redesigned product pages to include dimension call-outs, wood and fabric swatches, and lifestyle photography. Product-page conversion on key collection pages rose 71%, add-to-cart rate rose 42%, and average time on page rose 38% — evidence that buyers were actually finding the material and scale information they needed to move forward.
4. Post-purchase email
We built a focused post-purchase series covering care instructions and styling ideas — genuinely useful content for someone who just spent CAD $460-plus on a piece of furniture, not a generic thank-you note. Once fully ramped, it generated an estimated CAD $28,000 to $35,000 in monthly attributable revenue.
What didn't work
Furniture bought on discount doesn’t stay furniture
Not everything we tried worked, and the two corrections here weren’t the same kind of fix.
Pure discount-led creative — turned off entirely
We tested a pure discount-led creative approach. It attracted lower-intent, price-sensitive traffic with weak margin and weak repeat behavior, so we turned it off.
Broad “home décor” interest targeting — narrowed, not cut
Broad “home décor” interest targeting was consistently missing ROAS targets, so we narrowed it — not a full cut, but a tighter definition of who we were actually trying to reach.
- Blended ROAS
- 3.6x
- from 1.9x
- Monthly Revenue
- CAD $325k
- from CAD $135k
Revenue and ROAS, September 2024 to present
Cost per acquisition fell from CAD $285 to CAD $202, a 29% reduction. Site-wide conversion rate rose from 1.4% to 2.3%, a 64% increase, tracking closely with the product page work described above. Repeat purchase rate more than doubled, from 11% to 24% — and the share of customers returning within 90 days tracks closely with that same lift, so we’re treating it as supporting color here rather than a separately measured number.
We don’t think all of this came from the media program alone. Furniture and home goods spending is sensitive to broader housing and interest-rate conditions in Canada, and the September 2024 engagement start sits at the front edge of the fall home-refresh and holiday season — some of the lift plausibly reflects that calendar position, not media performance alone.
From a room-setting ad to a second order
The path a Havenwood customer takes today is built around answering the questions a considered purchase actually raises, before and after the sale.
Google Shopping’s growing share of the mix
What changed when furniture stopped being generic
Four workstreams ran across the engagement, summarized here and detailed in the table below.
| Channel / Workstream | What We Did | Why It Mattered |
|---|---|---|
| Google Shopping | Product-level bidding plus enhanced titles and attributes (wood species, dimensions, finish). | Gave the algorithm enough data to match pieces to searches — revenue share rose from 31% to 47%. |
| Meta Ads | Room-setting video and carousel creative, shot in real home interiors. | Let buyers see scale and material in context; mature campaigns reached 4.1x–4.8x ROAS. |
| CRO | Product page redesign: dimensions, wood/fabric swatches, lifestyle photography. | Product-page conversion up 71%, add-to-cart up 42%, time on page up 38%. |
| Lifecycle Email | Post-purchase care-and-styling email series. | Generated an estimated CAD $28,000–$35,000 in monthly attributable revenue once ramped. |
Havenwood against a typical furniture / home goods DTC account
| Metric | Typical Furniture / Home Goods DTC Account | Havenwood Home (Actual, CAD) |
|---|---|---|
| Blended Marketing Efficiency (MER/ROAS) | Furniture & home goods typically run 1.5x–2.5x blended MER, per Admetrics' 2026 DTC performance reporting benchmarks. 1 | 3.6x, up from 1.9x |
| Cost Per Acquisition | Home & garden CAC runs around a $60 median across 4,000+ Shopify brands, per Eightx's home goods financial benchmark report. 2 | CAD $202, down from CAD $285 |
Fourteen months of compounding, not one big month
Blended ROAS moved from 1.9x to 3.6x. Monthly revenue grew from CAD $135,000 to CAD $325,000, up 141%. Cost per acquisition fell from CAD $285 to CAD $202. Repeat purchase rate more than doubled, from 11% to 24%. None of this happened in a straight line, and we don’t think it happened from the media program in isolation.
Customer mix
Before
31%
Google Shopping
After
47%
Google Shopping
Google Shopping moved from 31% to 47% of the total, with Other channels making up the remainder — a gain of 16 points.
There wasn't one dramatic month where everything changed — it was closer to compounding, month over month.
Your budget deserves better.
More results
Other engagements.

3.9x
Blended ROAS
from 1.6x
3.9x ROAS and $265k in Monthly Revenue for a Los Angeles Apparel Brand
We took Vespera Apparel from a single undifferentiated Meta campaign and a 14% repeat purchase rate to a segmented account and real retention infrastructure — nearly tripling blended ROAS along the way.

6.4x
Blended ROAS
from 1.8x
6.4x ROAS and $4.8M in Revenue for Luminara Jewelry
We took Luminara from a fatigued, single-tier Meta account and an unoptimized Google feed to a trust-and-consideration funnel built for a $480 purchase — and generated $4.8M in revenue along the way.

3.8x
Blended ROAS
from 1.7x
214% Revenue Growth and 37% Lower Cost Per Purchase for an Austin Skincare Brand
We took Velora Beauty from a hero-product-only account with fatigued creative to a routine-building brand — and nearly doubled repeat purchase rate in the process.